My Open Source Journey
Open source projects are a great way to gain real world experience. From setting up the development environment, learning a complex code base, to writing tests and figuring out merge conflicts, it necessitates all the skills required to work in a real world development team. This is the reason I chose to endeavor in open source.
I originally chose Firefox because someone else I knew had some success writing patches. When I first looked at the documentation, I was pretty intimidated. There was a lot of terminology I wasn't familiar with, and a lot of technical dependencies that were very foreign to me.
First Steps and Challenges
Eventually I got the development environment up and running. Known bugs in the debugger software are posted publicly by Firefox. Just looking through the bug list and understanding what would be an appropriate choice for a beginner is a daunting task in itself. I decided to look for CSS bugs, because they might be simple, and might not require writing a test to go along with the patch. I made a list of possibly appropriate bugs and whittled it down from there.
My First Bug Fix
The first bug I worked on involved some lines of text overlapping each other in the debugger. I learned how to make small changes, build Nightly, which is the developer version of the Firefox browser, and then view my changes in a freshly built version. After making what looked like the correct changes to fix the problem, I was ready to submit my patch.
I was quite afraid submitting my first patch. What if it is wrong, or what if it doesn't submit properly? Is my commit message written properly? I didn't want to inconvenience the maintainers. Fortunately, my patch went through, and after some minor back and forth with the maintainer, my patch was accepted and merged into the code base.
Taking on JavaScript Bugs
Next I wanted to tackle a bug that involved JavaScript. Once again, I looked at the available bugs posted, made a list of possible candidates, and then ranked each bug by what would be the most simple. Unfortunately I erred in this estimation and spent about a month investigating a bug that was not skill appropriate for me.
I was very comfortable with vanilla JavaScript at this time but not familiar with React or Redux, which the debugger uses extensively. To diagnose bugs in the debugger, you basically run the debugger on the debugger. The debugger is written in JavaScript and uses React for components and Redux to control the flow of data. I spent some time learning about React and Redux and was able to glean a lot about this particular bug, but a fix worthy of submitting continued to elude me.
Learning to Write Tests
I decided to go back to my bug list and found a bug that a lot of other "students" like myself had attempted to solve but gave up when confronted with writing tests. The code change to fix the bug was simple and already posted, but to submit the patch, automated "mochitests" were required, which are basically asynchronous functions that mimic a user using the debugger as intended. When you run them, it fires up a browser and you can see the mouse movements and all the GUI actions you might perform yourself.
I thought, "If I can figure out how to write these tests, I can submit this patch, and be prepared to write more tests in the future for bugs whose code changes I figure out myself."
Each debugger component has its own set of tests. So I was able to locate them in the code base and read the existing tests for that component. Unfortunately, it was completely opaque to me. The syntax was familiar, but what was happening in each test was not apparent.
Breaking Through Obstacles
I can see why so many others had given up at this point. I looked up the documentation for the mochitests. They describe what the tests do and are for, but the minutiae is not explained. I decided to look at every test in the debugger and make notes of which were the shortest. From there I was able to make small code changes and see what they did.
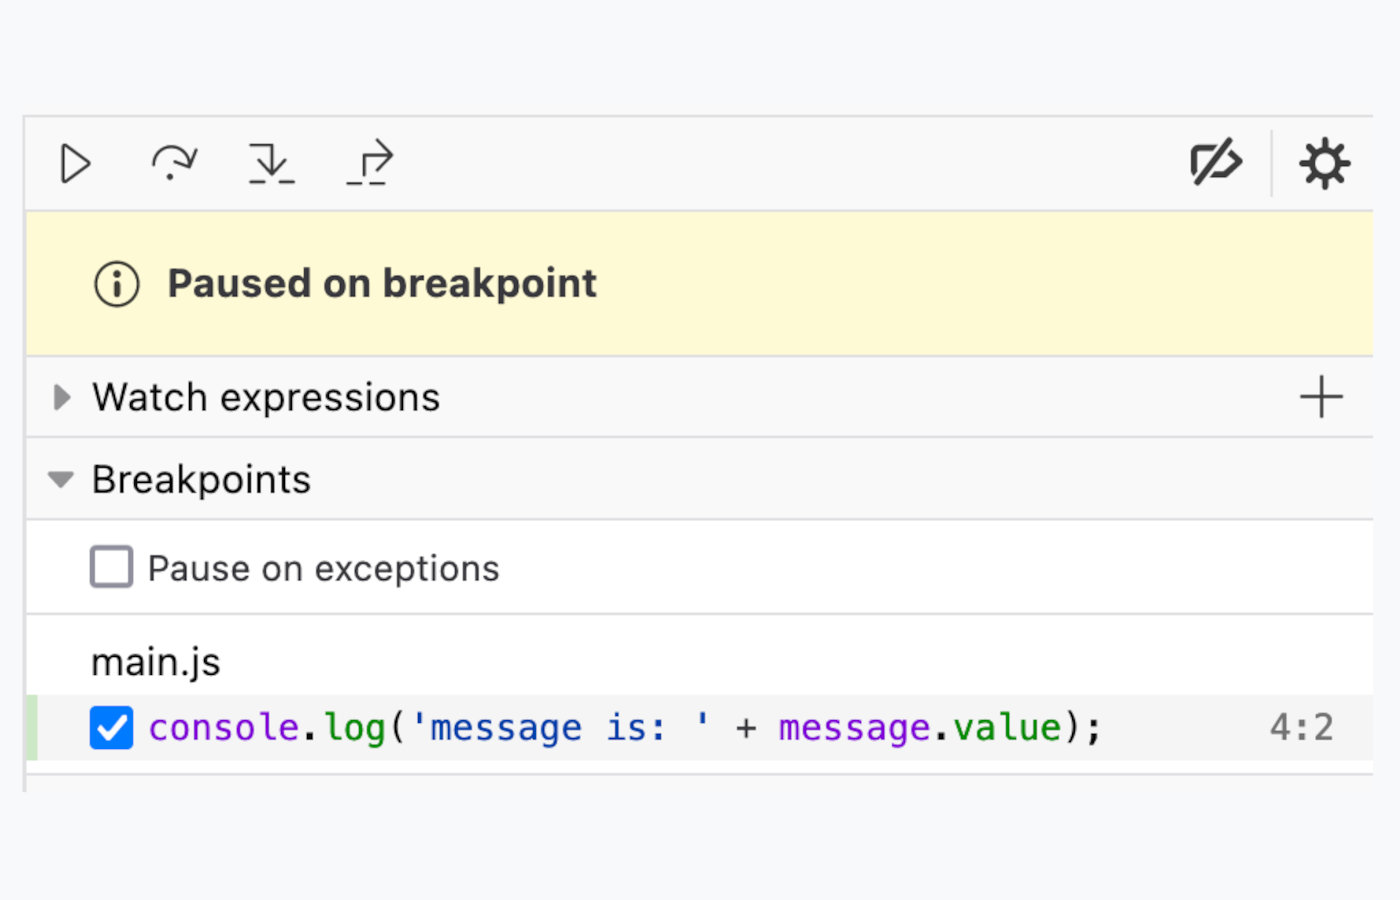
I broke a lot of tests. I added lots of debugger statements and paused tests that were in the process of running, so I could stop and look around the GUI and see what they were doing. I spent several weeks doing this. After many instances, I began noticing patterns. I began to see familiar snippets that had been used in other tests, functions local to individual tests, and the general way the browser is manipulated inside the tests.
Writing My First Test
I started writing my own tests for my patch. I often would have to look up a similar test and borrow code for my own. At this point, I still didn't always understand the correct context of everything, but I was able to run the tests, pause them with debugger statements, and see if the browser was doing what I wanted. Often it was not, and I would spend a whole day trying to figure out how to make it do one small task.
The other difficult issue was having an assertion fail and then having to figure out why. Gradually my first mochitest appeared to be working and all my assertions were passing. Before submitting, I brainstormed all the edge cases I could think of. When I couldn't come up with anymore I submitted my patch. The reviewer said it looked good and asked for one additional assertion, which I added, and my patch was landed! I felt very empowered by this patch. I had a long way to go still, but I didn't give up and I figured out how to write the tests on my own.
Tackling More Complex Bugs
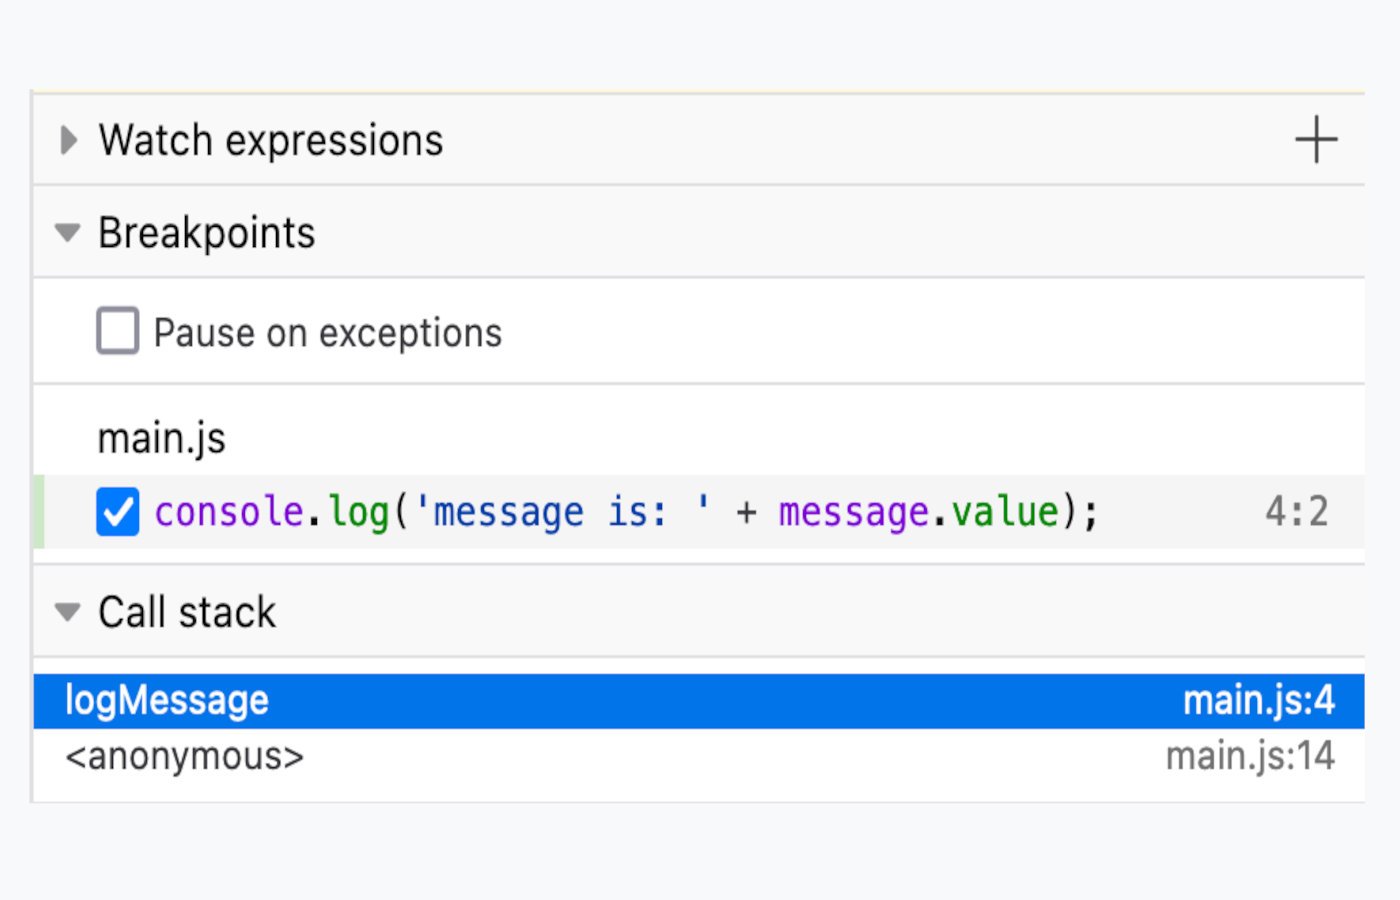
The next bug I tackled involved the breakpoints pane expanding unexpectedly when selecting a call stack frame. It should remain closed, if the user has collapsed it. By reading the code and stepping through it with the debugger, I was able to understand why this was happening.
I came up with two solutions that would fix the problem. Having read so many bugs, I realized there was a related bug. The breakpoints pane also expands unexpectedly when you click any of the "step" buttons. One solution made sense to me more than the other and would fix both bugs, so I decided to implement it.
I realized that there were aspects of both React and Redux that I thought I understood, but really didn't. I had to spend some time making simple React Redux apps to better understand the flow of information. Once I did this, I was able to implement the solution. Then it was time to write tests. Empowered by my last bug, I drove right in. I still had days where I spent hours trying to figure out a small problem, but once again I was able to figure out the solution.
Growing Confidence
Though this account is brief, I worked on this bug for quite a while. Sometimes the maintainers are too busy to review your patch right away when you post it. I had a good deal of back and forth on this one. I wrote a lot of tests. I learned a lot about Redux and how data moves through the ecosystem.
Eventually the maintainers approved my work and my patch landed. This bug empowered me to go back to the bug I failed to fix earlier on. Having some experience now, I wasn't as nervous to try different ideas. I ended up landing that patch and several others. I feel confident now to take on more difficult bugs.
Lessons Learned
Open source has taught me that I can solve problems in a complex code base. I can work within a team that has a defined system and succeed. I learned that everything might be hard at first, but through focus and persistence, you can figure it out!
